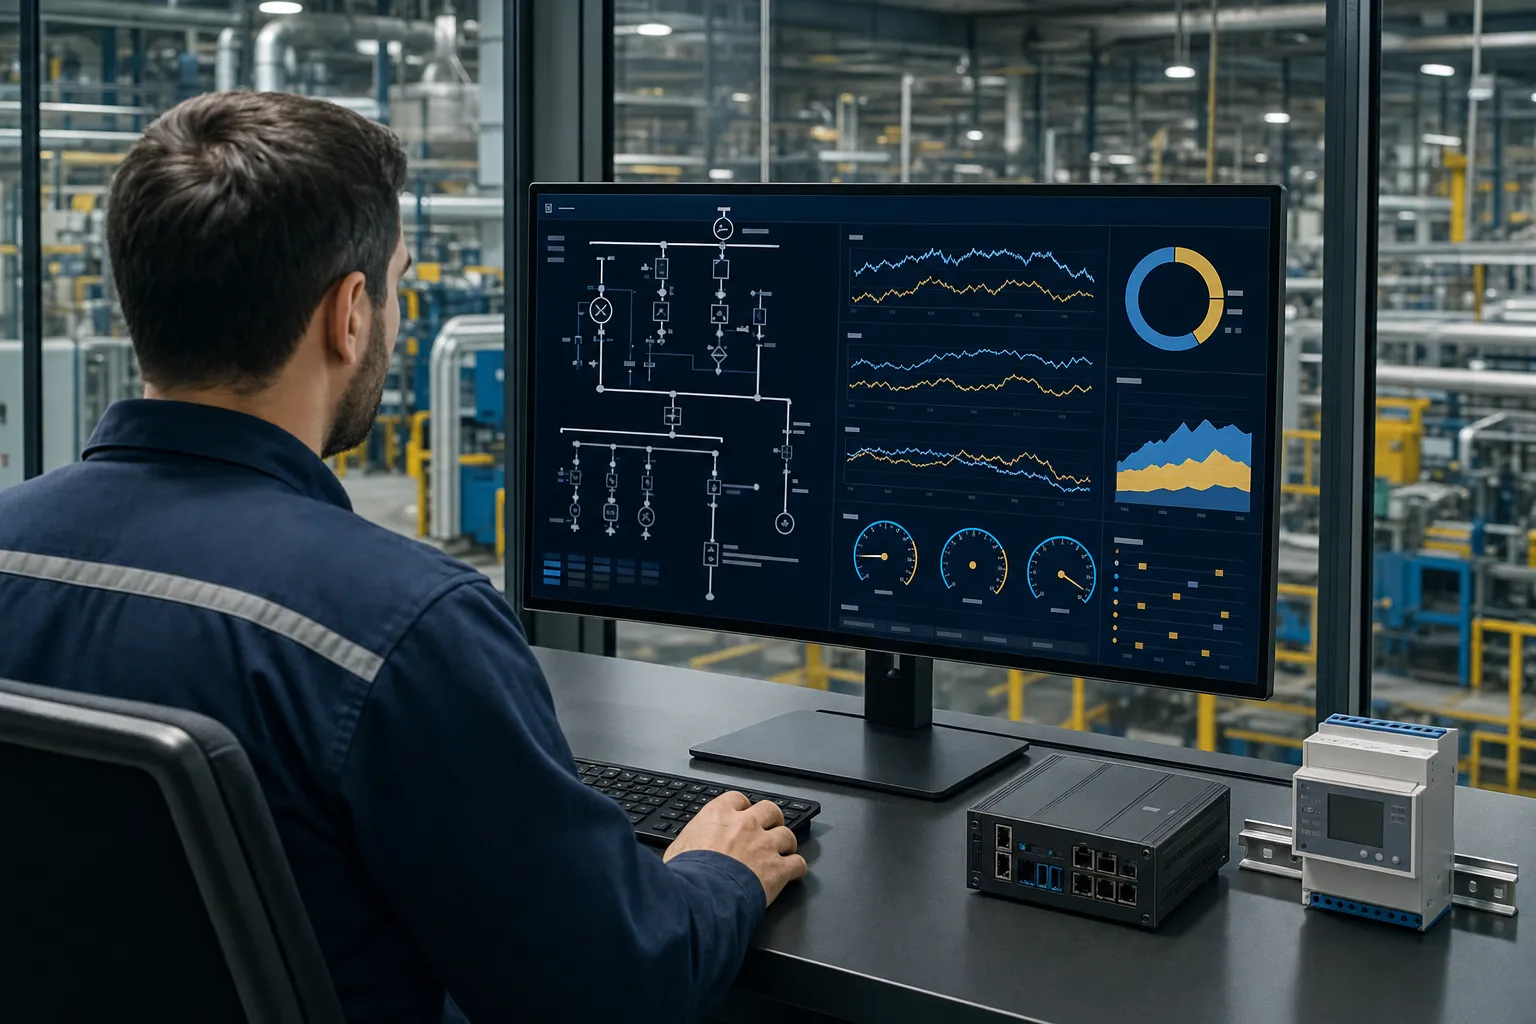
An edge-to-cloud flow that acquires measurements, contextualises them by site and machine, visualises them and generates alerts.
CONTEXT
Context and objective
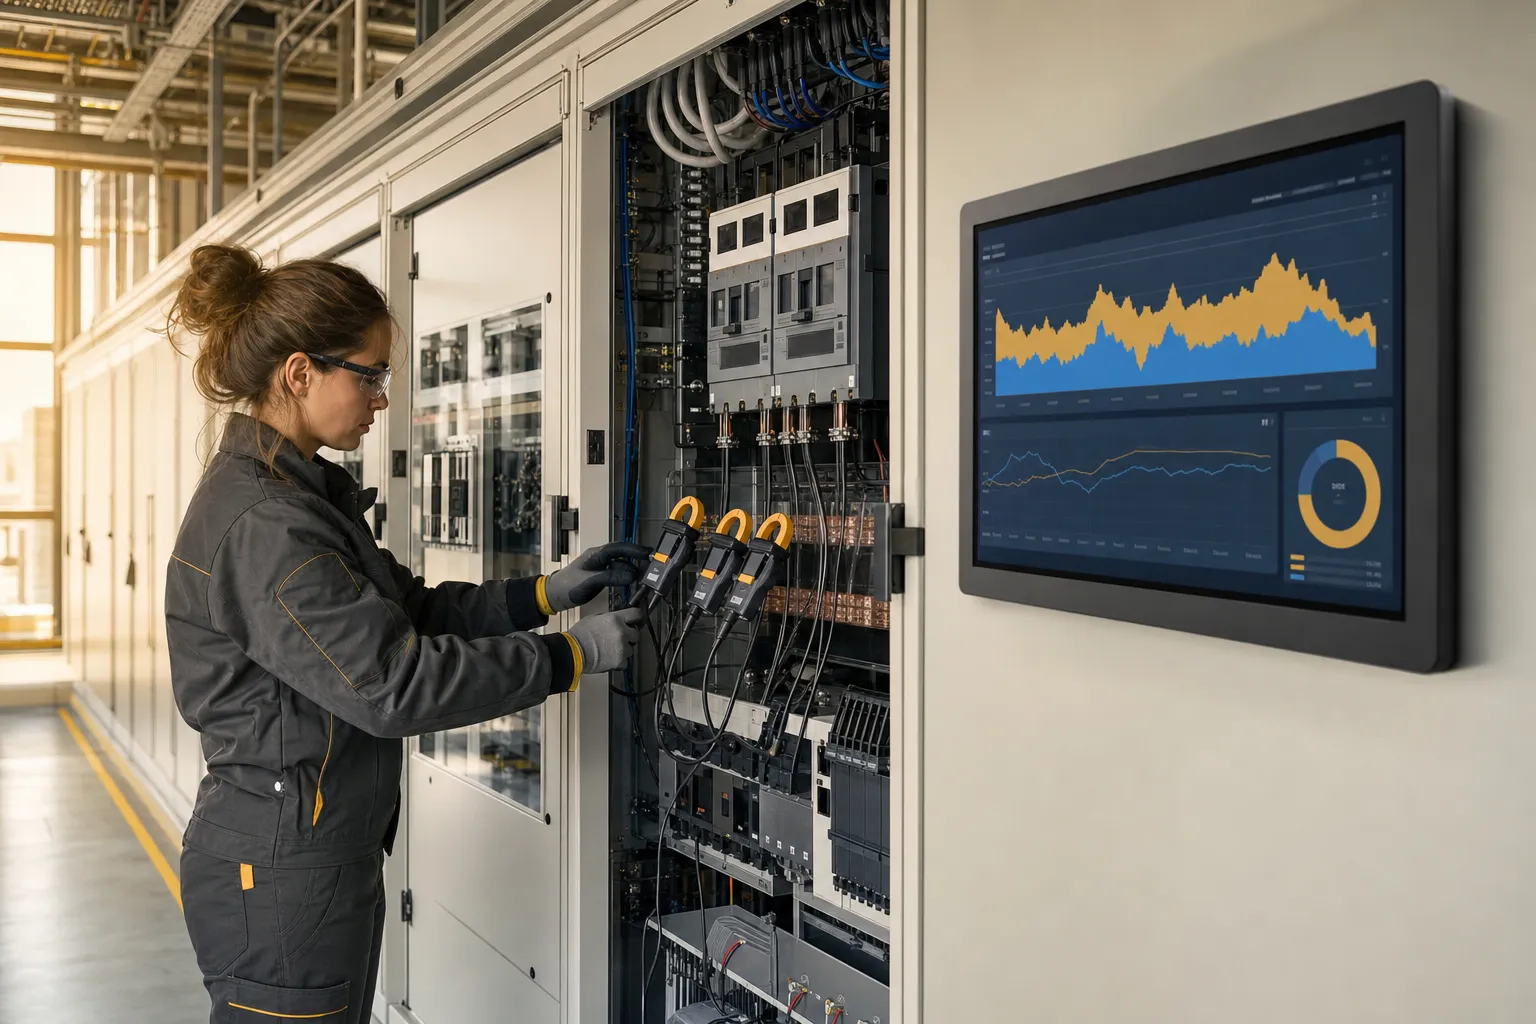
Isolated readings or context-free dashboards are not enough to operate a plant. Measurements need reliable acquisition, asset association, coherent rates and alerts with operational meaning.
SYSTEM
Architecture
Sensors or smart meters connect through a gateway or available network. Data is normalised, sent to a broker or IoT hub, stored and aggregated for dashboards, APIs and alert rules.
Devices and sensors
- Smart meters and current transformers
- Interfaces to inverters or machines
- Edge gateway where required
- Ethernet, Wi-Fi or cellular connectivity
Connectivity and protocols
- Modbus RTU/TCP or OPC UA where available
- MQTT telemetry
- TLS transport
- APIs for existing-system integration
Dashboards and operations
- Site overview
- Machine or sensor drill-down
- Thresholds and alerts
- Connectivity and data-quality diagnostics
HDA contribution
- Source analysis and sensor selection
- MQTT and data-integration architecture
- Dashboard and alert model
- Cloud or on-premise rollout support
EVIDENCE
Outcomes and evidence
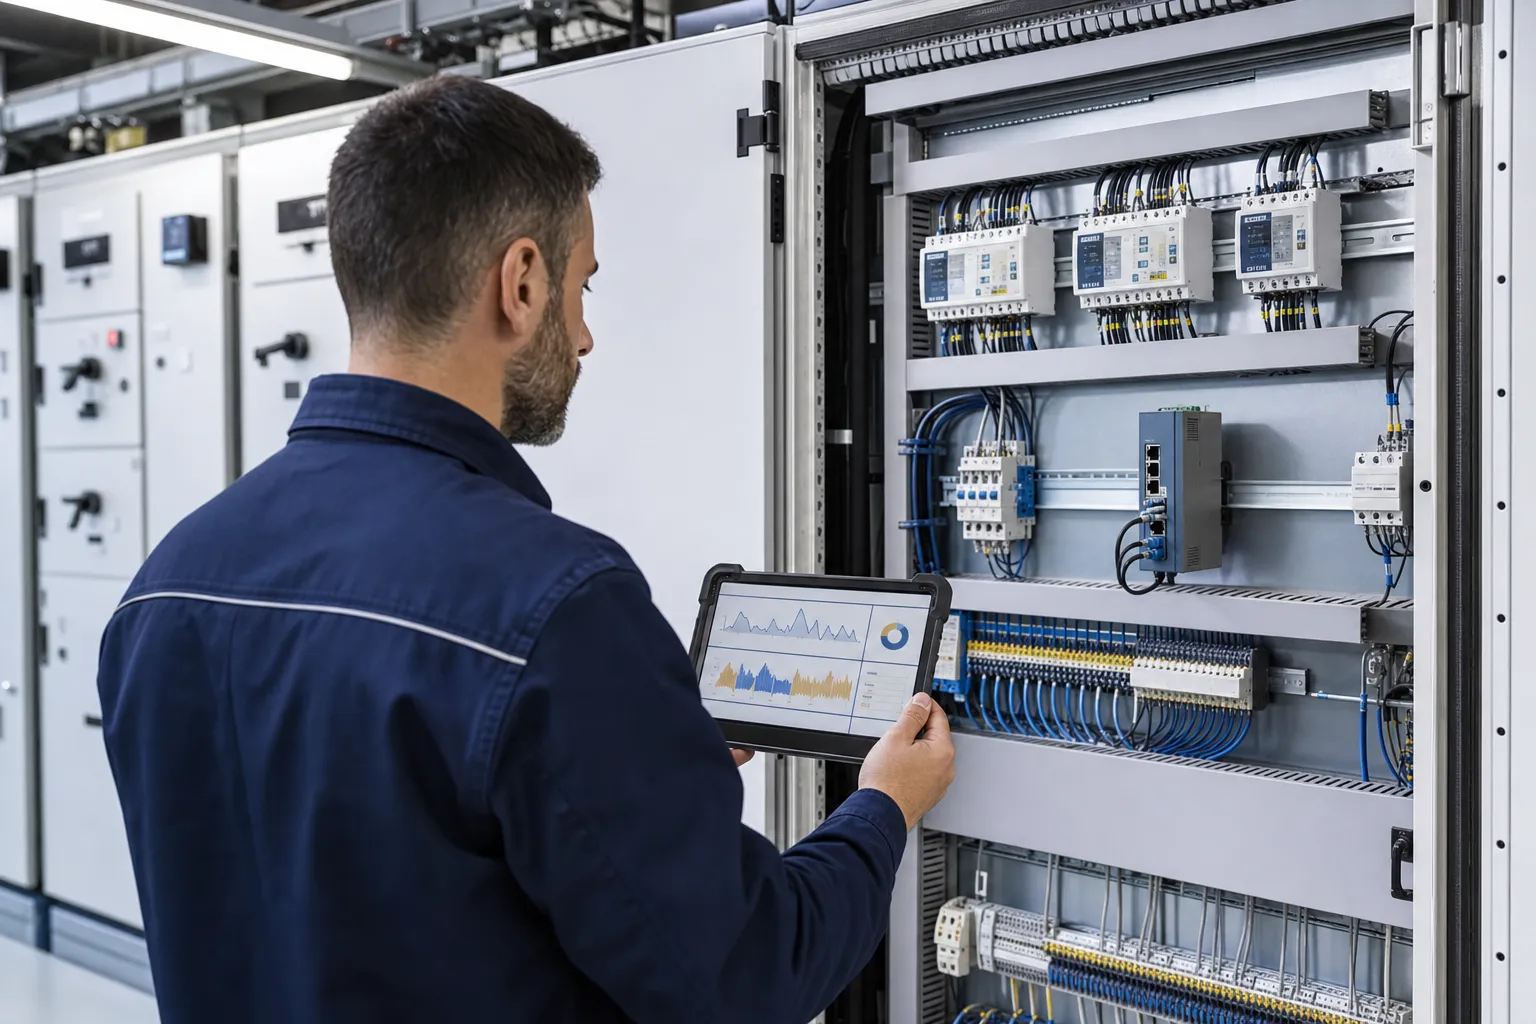
Dashboard screenshots and photographs of a trade-show demonstrator are available. Quantitative benefits depend on each plant’s baseline and process and are not anticipated here.
TRUST
Role of Trusted Data
Relevant when measurements support reporting, contractual comparison or audit. Meter identity, timestamps and transformations then become part of the evidence chain.